Mastering the Triangle Pattern in Trading: A Simple Guide
Introduction
Have you ever looked at a trading chart and thought it looked like modern art? All those lines, shapes, and zigzags can seem overwhelming. But what if I told you that some of those patterns—like the triangle pattern—can actually help you make smarter trading decisions?
Yes, it’s true. Patterns like the symmetrical triangle pattern are like road signs on the highway of trading. They give us clues about what might happen next.
In this guide, we’re going to break it all down for you. No jargon. No PhD-level finance terms. Just a clear and easy explanation of the triangle pattern in trading—especially the symmetrical triangle—and how tools like algorithmic trading software and even the best algo trading software in India can help you use these patterns like a pro.
Understand the symmetrical triangle pattern in trading. Learn how it helps in algorithmic trading software and the best algo trading software in India.
What Is a Triangle Pattern in Trading?
A triangle pattern is a shape formed on a trading chart when the price of an asset moves within converging trendlines. It looks like—yes, you guessed it—a triangle. Traders use it as a signal to predict future price movements. Think of it as the market “taking a pause,” gathering energy before making its next move.
Types of Triangle Patterns
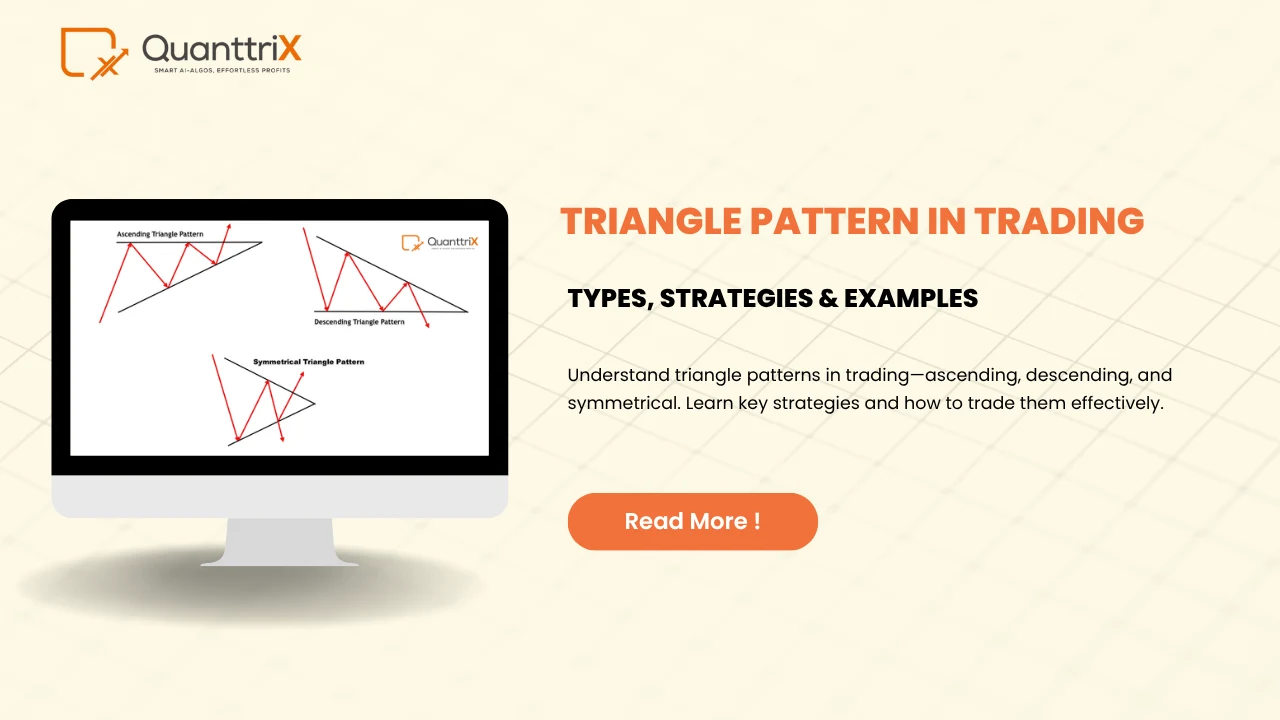
There are three main types of triangle patterns:
- Symmetrical Triangle
- Ascending Triangle
- Descending Triangle
Each one tells a slightly different story about what the market might do next. In this article, we’ll zoom in on the symmetrical triangle pattern.
What is a Symmetrical Triangle Pattern?
A symmetrical triangle pattern occurs when the price is moving in a way where both the highs and the lows are converging. Imagine drawing a line connecting the highs and another line connecting the lows. Over time, they move closer and closer, forming a triangle that’s perfectly balanced on both sides.
It’s like a tug of war between buyers and sellers where neither side is winning—yet.
Why Do Symmetrical Triangles Matter in Trading?
Because they often signal that a big move is coming. The market has been squeezing into a tighter range, and it can’t stay that way forever. When it finally breaks out—either up or down—that’s where traders jump in.
For many traders, spotting a symmetrical triangle is like seeing a coiled spring. You know it’s about to snap, but the direction is the mystery.
How to Spot a Symmetrical Triangle on a Chart
It’s easier than you think. Look for:
- A series of lower highs (price goes up, but not as high as before).
- A series of higher lows (price drops, but not as low as before).
- The two lines converging toward each other over time.
Here’s a tip: most symmetrical triangles form over a few weeks, though some can appear within days on shorter time frames.
Real-Life Analogy: The Squeezing Spring
Imagine you’re pressing down on a spring with both hands. The more you push from each side, the more tension builds up. Eventually, one hand gives way and the spring shoots out in that direction.
That’s exactly what happens in a symmetrical triangle pattern. The market pressure builds until—BAM!—it breaks out, often with a burst of energy.
Breakouts: What Happens After the Triangle Ends?
When the triangle ends, the price breaks out. This can happen:
- Upwards, if buyers win the battle.
- Downwards, if sellers take over.
The breakout is usually fast and powerful. That’s why many traders use algorithmic trading software to set alerts or even place trades automatically once the pattern breaks.
Using Triangle Patterns in Day Trading
For day traders, triangle patterns are gold. Why?
Because they:
- Help identify breakout opportunities.
- Provide clear entry and exit points.
- Fit perfectly into short-term strategies.
When you’re dealing with seconds and minutes, knowing that a breakout is likely makes a huge difference.
Triangle Patterns in Algorithmic Trading
Here’s where things get exciting.
Algorithmic trading software (also called algo trading) can:
- Detect triangle patterns automatically.
- Backtest thousands of historical charts to confirm results.
- Execute trades instantly the moment a breakout happens.
This removes human emotion—and error—from the process.
How the Best Algo Trading Software in India Helps
If you’re trading in India, you’ll find plenty of options. But only the best algo trading software in India offers:
- Real-time pattern recognition.
- High-speed trade execution.
- Custom strategies built around triangle breakouts.
- Integration with Indian stock markets like NSE and BSE.
Some even provide mobile apps, so you can trade triangles while sipping chai on your balcony.
Mistakes to Avoid with Triangle Patterns
Not every triangle leads to profits. Watch out for these common errors:
- Entering too early before the breakout is confirmed.
- Ignoring volume—a breakout with low volume might be fake.
- Forgetting stop-losses—not every breakout goes your way.
Patience and confirmation are your best friends here.
How to Confirm a Triangle Pattern
Before betting the house on a triangle breakout, confirm with:
- Volume increase near the breakout.
- Break above/below the trendline with a solid candle.
- Support from other indicators like RSI or MACD.
Confirmation helps reduce false breakouts—a trader’s worst nightmare.
Volume and Triangle Patterns
Volume is like the applause in a theater. If the breakout gets a loud cheer (high volume), it’s more likely to succeed.
Low volume? That breakout might just be a weak whisper. Many algorithmic trading software tools analyze volume alongside patterns to give better signals.
Backtesting with Algorithmic Trading Software
Backtesting means testing your strategy on past data. It’s like a dress rehearsal before the big show.
The best algo trading software in India offers deep backtesting features. You can:
- See how your triangle strategy would’ve worked in the past.
- Tweak entry and exit rules.
- Improve your odds before risking real money.
Final Thoughts on Trading with Confidence
Trading doesn’t have to feel like gambling. When you understand patterns like the symmetrical triangle, you’re making informed choices—not just rolling dice.
Add in the power of algorithmic trading software, and you’re putting your strategy on autopilot. Whether you’re just starting or already dabbling in trading, learning how to use the triangle pattern can give you an edge.
And in today’s competitive markets, an edge is everything.
FAQs
What is the main difference between symmetrical, ascending, and descending triangles?
A symmetrical triangle has converging trendlines. Ascending triangles have a flat top with rising lows. Descending triangles have a flat bottom with falling highs.
Can I trade triangle patterns using algorithmic trading software?
Absolutely! Many platforms can detect triangle patterns and even trade breakouts automatically.
Why is volume important in triangle patterns?
Volume confirms the strength of the breakout. A strong move with high volume is more trustworthy.
Which is the best algo trading software in India for triangle pattern strategies?
Look for platforms with pattern recognition, NSE/BSE integration, fast execution, and backtesting tools. Examples include Quanttrix, AlgoTrader, and Tradetron.
Can beginners use symmetrical triangle patterns effectively?
Yes! They are one of the easier patterns to spot and understand, especially with simple visual cues and confirmation techniques.