
What is Dew Point?
Dew point is the temperature at which air becomes saturated with moisture and water vapor condenses into liquid. It is a critical measure in meteorology, HVAC systems, aviation, and various industrial applications. Unlike relative humidity, which depends on temperature, dew point provides a direct measure of atmospheric moisture content.
Why is Dew Point Important?
The dew point is crucial because it influences comfort levels, weather patterns, and industrial processes. A high dew point indicates high moisture content, leading to discomfort, especially in warm weather. Conversely, a low dew point results in dry conditions that may cause skin irritation and respiratory issues.
Understanding the Dew Point Chart
A dew point chart is a tool used to determine the dew point temperature based on air temperature and relative humidity. It helps in understanding the relationship between humidity and temperature, allowing professionals to predict condensation levels, fog formation, and air quality.
How to Read a Dew Point Chart
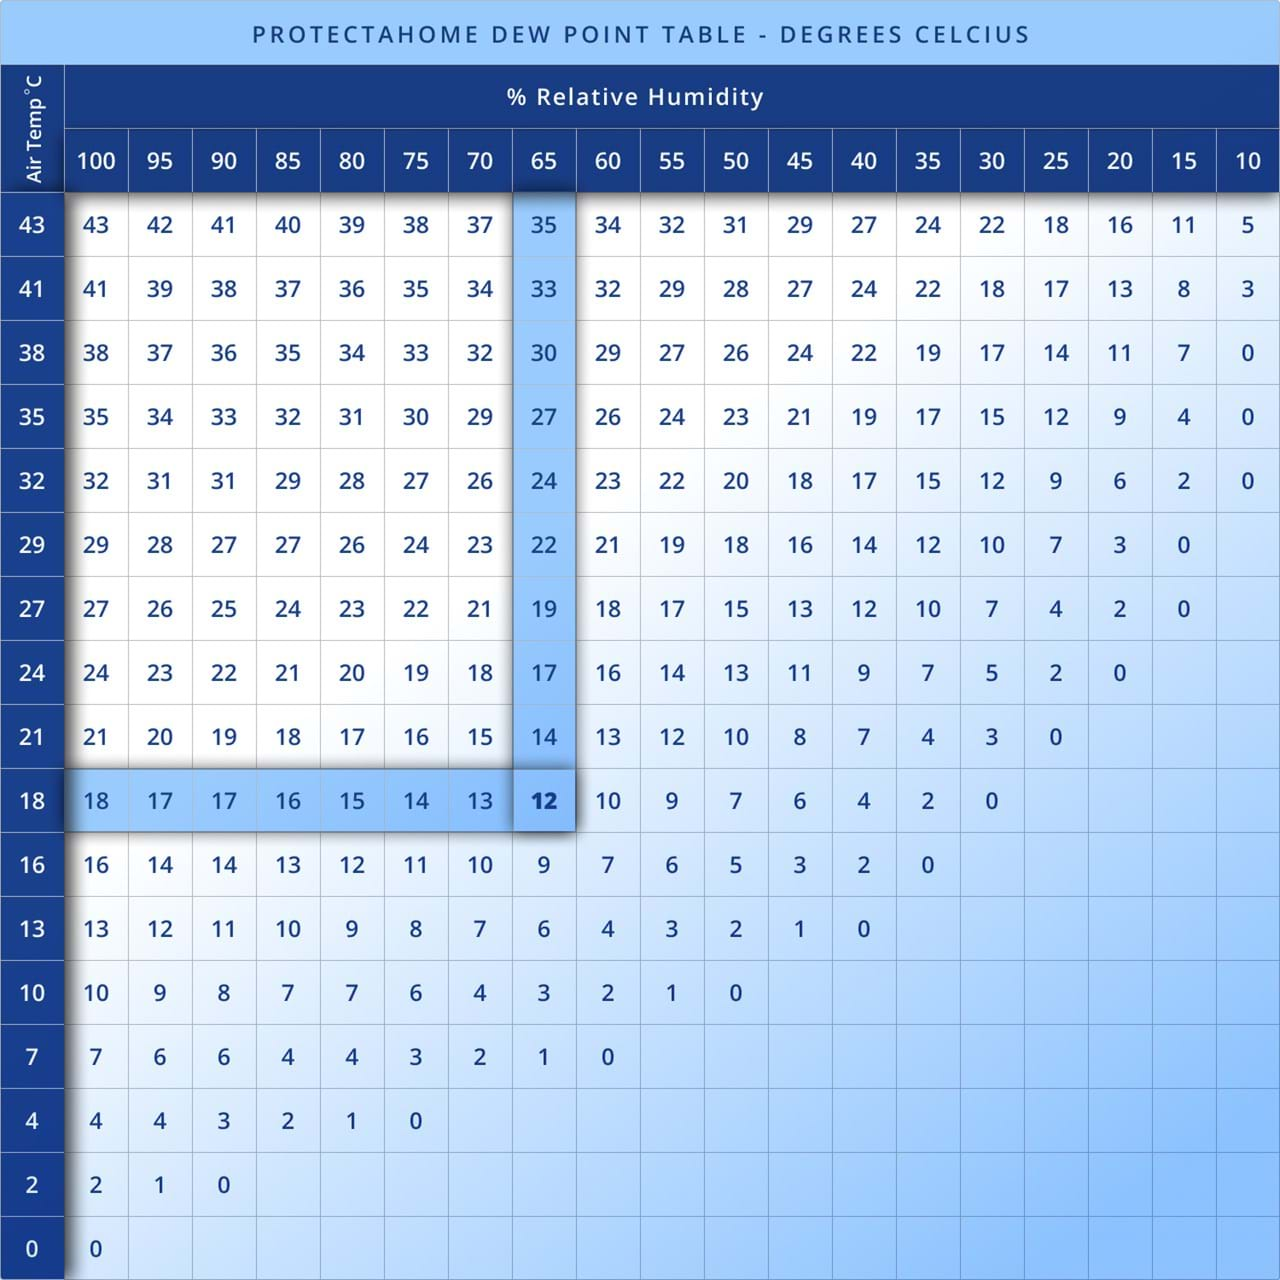
A typical dew point chart consists of:
Air Temperature (°F or °C) – The actual temperature of the air.
Relative Humidity (%) – The percentage of moisture in the air compared to the maximum it can hold at a given temperature.
Dew Point Temperature (°F or °C) – The temperature at which condensation occurs.
To use the chart:
- Locate the current air temperature on the left column.
- Find the relative humidity across the top row.
- The intersection of these two values gives the dew point temperature.
For example, if the air temperature is 80°F and the relative humidity is 60%, the dew point is approximately 65°F. This means that if the temperature drops below 65°F, condensation will begin to form.
Dew Point and Comfort Levels
The dew point is often used as an indicator of human comfort levels:
- Below 50°F – Dry and comfortable.
- 50-60°F – Slightly humid but still comfortable.
- 60-65°F – Noticeably humid.
- 65-70°F – Uncomfortable for many people.
- Above 70°F – Oppressive and very humid.
Applications of the Dew Point Chart
Weather Forecasting
Meteorologists use dew point charts to predict fog, rain, and storm potential. A higher dew point indicates greater moisture in the atmosphere, increasing the likelihood of precipitation.
HVAC Systems
In heating, ventilation, and air conditioning (HVAC), dew point charts help in controlling indoor humidity levels. By maintaining an optimal dew point, HVAC systems can prevent mold growth and ensure comfort.
Aviation Industry
Pilots use dew point charts to determine visibility and weather conditions. A small difference between air temperature and dew point suggests potential fog, which can affect flight safety.
Industrial Processes
Industries such as pharmaceuticals and food production rely on dew point measurements to prevent condensation-related damage. Maintaining a stable dew point ensures product quality and equipment longevity.
Dew Point vs. Relative Humidity
Though closely related, dew point and relative humidity differ:
- Dew Point: A direct measure of moisture in the air, independent of temperature.
- Relative Humidity: A percentage indicating how much moisture the air holds relative to its maximum capacity at a given temperature.
For example, at 90°F with 50% humidity, the air feels much more humid than at 70°F with the same 50% humidity because warmer air holds more moisture.
How to Control Dew Point Indoors
To maintain a comfortable and moisture-free environment indoors:
Use Dehumidifiers: Reduces excess moisture in the air.
Improve Ventilation: Ensures air circulation and prevents stagnation.
Seal Leaks: Prevents moisture intrusion from outside.
Use Air Conditioning: Helps regulate temperature and humidity.
Conclusion
A dew point chart is an invaluable tool for understanding moisture levels in the air. Whether for weather forecasting, HVAC systems, aviation, or industrial applications, knowing how to interpret dew point data can significantly improve decision-making and comfort. By using dew point charts effectively, we can better prepare for varying humidity conditions and create more comfortable living and working environments.